Aguayo

D User Behavior Analysis: How to Interpret Heatmaps and Clicks

Por Redacción Aguayo

When it comes to improving user experience (UX), nothing is more revealing than observing how people interact with a website. Where do they click? Which sections do they spend the most time on? Which ones do they completely ignore? Heatmaps and click analysis are key tools to answer these questions, providing a detailed view of user behavior. But interpreting them correctly goes beyond just looking at colors and bright spots on a screen—it requires context, intent, and a well-thought-out optimization strategy.

mapas de calor
CAPTION: Photo generated from Midjourney

KPIs in UX: What Are They and Why Do They Matter?

Heatmaps are visual representations of user behavior on a digital interface. They use a color scale to show interaction levels in different areas of a website or application.

  • Warm colors (red, orange, yellow): Indicate high activity, such as frequent clicks, longer time spent, or intense scrolling.
  • Cool colors (blue, green): Represent areas with lower interaction, which may suggest a lack of interest or poor usability.

This type of analysis is essential for understanding how users navigate and identifying which areas need optimization in terms of design and content.

Click Analysis: Identifying Interaction Patterns
Click analysis is a technique that records the exact points where users click within a page. Unlike heatmaps, which present aggregated data in a color spectrum, click analysis allows for a more precise study of user behavior.

What Information Does It Provide?

  • Usage patterns: Identify which elements attract the most attention and which go unnoticed.
  • Distractions and errors: Reveal clicks on non-interactive areas, which may indicate confusion with the interface.
  • Design optimization: Help evaluate whether buttons and links are strategically placed for a better user experience.

Importance in UX/UI Design
Both tools are fundamental for UX/UI designers as they enable data-driven decisions instead of relying on assumptions. With this information, it’s possible to:

  • Improve website usability.
  • Optimize conversions by identifying key interaction areas.
  • Detect friction points in user navigation.

Types of Heatmaps and Their Uses

  1. Click Maps
    These maps record the exact points where users click most frequently. They are essential for evaluating the effectiveness of interactive elements within a website.

What Are They Used For?

  • Identifying the most and least attractive buttons and links: This helps verify if calls to action (CTAs) are well-placed and effectively designed.
  • Detecting erroneous clicks: If users click on non-interactive elements, it could signal confusion in the interface.
  • Optimizing the layout of key elements: Allows for reorganizing content based on users’ actual browsing habits.
  1. Scroll Maps
    Scroll maps show how far users scroll down a page. They are useful for understanding how content is consumed and whether users are reaching the most relevant information.

What Are They Used For?

  • Determining if users reach the most important content: If the key section of the page isn’t seen by most visitors, its placement should be reconsidered.
  • Identifying where users lose interest: Helps detect if the content is too long or if the page structure is ineffective.
  • Defining the ideal page length: Based on actual behavior, you can adjust content length to maximize user retention.
  1. Cursor Movement Maps
    This type of map tracks the path of the cursor on the screen, which can indicate areas of higher visual attention before the user clicks.

What Are They Used For?

  • Determining which areas catch attention before clicking: If users hover over an element without interacting, it may indicate uncertainty or a lack of clarity.
  • Evaluating if key content is attracting attention: Helps verify if important information is strategically placed within the interface.
  • Identifying visual distractions: If the cursor frequently moves toward secondary elements, the design may need adjustments to redirect user focus.

How to Effectively Interpret Heatmaps and Clicks

Looking at a heatmap without context is like trying to understand a story by only seeing the colors on the cover. To make the most of them:

  • Compare with Page Goals:
    If a conversion button isn’t getting clicks, it might be in the wrong place or not visually compelling enough.
  • Identify Friction Points:
    If users click on non-interactive elements, there may be design issues or unmet expectations.
  • Review Scrolling Patterns:
    If key content is too far down and few users see it, it’s time to reconsider the page structure.
  • Cross-Reference with Other Metrics:
    Combine heatmaps with tools like Google Analytics to see how visual interaction relates to conversion and retention.

Common Mistakes When Analyzing Heatmaps

Heatmap analysis is a powerful tool for improving user experience, but incorrect interpretation can lead to poor decisions. Here are some common mistakes to avoid:

  1. Not Considering Different Devices
    User behavior on desktop differs from mobile or tablet. Ignoring these differences can lead to inaccurate conclusions about usability and design effectiveness.

How to Avoid It:

  • Analyze heatmaps separately for each device type.
  • Consider differences between touch navigation (mobile/tablet) and cursor navigation (desktop).
  • Optimize key elements like buttons and calls to action (CTAs) based on the device.
  1. Drawing Hasty Conclusions
    An area with many clicks doesn’t always mean it’s performing well. Sometimes, a high number of clicks indicates usability issues.

Examples of Misinterpretation:

  • A button with many clicks might seem effective, but if there are clicks nearby, it could mean the button isn’t clear enough.
  • Unexpected click areas may reveal confusion, with users trying to interact with non-clickable elements.

How to Avoid It:

  • Cross-reference heatmap data with additional metrics (conversion rates, session duration, A/B tests).
  • Evaluate whether clicks align with expected actions or reflect user frustration.
  1. Not Segmenting Users
    Not all users navigate the same way. A new visitor may interact differently than a returning user.

Useful Segmentation Examples:

  • New vs. returning users: New visitors might explore more, while returning users seek direct actions.
  • Potential customers vs. casual users: A user in the purchasing process pays more attention to product details or pricing.
  • Geographic differences: Browsing habits can vary by region or culture.

How to Avoid It:

  • Use analytics tools that allow segmentation by user type.
  • Compare heatmaps across segments to identify specific patterns.
  1. Ignoring the Navigation Context
    Cursor movement doesn’t always indicate click intent. Sometimes, users are just visually exploring without planning to interact.

Examples of Incorrect Interpretation:

  • A user hovering over a button but not clicking doesn’t mean the button isn’t appealing—they might be comparing options or hesitating.
  • High cursor movement in an area doesn’t always mean interest; it could just be passive exploration.

How to Avoid It:

  • Complement heatmaps with session recordings and usability tests.
  • Analyze time spent on sections to understand if they truly capture attention.

Applying Heatmap Insights to UX Optimization

To ensure heatmap insights lead to real improvements:

  • Reinforce Key Points: If a section gets visual attention, use it strategically for key information or CTAs.
  • Optimize Design Based on Actual Interaction: If users don’t scroll enough, reconsider page length or move important elements higher.
  • Test Changes and Measure Impact: Use A/B tests to validate data-driven modifications. A small adjustment in button placement can make a big difference.

Conclusion:

Conclusion

Heatmaps and click analysis are powerful tools for understanding user behavior on a digital interface. However, their true value doesn’t lie solely in the vibrant colors they display, but in the strategic interpretation of the data they reveal.

Beyond visualization, these analyses help identify interaction patterns, detect friction points, and uncover improvement opportunities within a website or application. It’s not just about seeing where users click, but understanding why they click (or don’t) and how this impacts their browsing experience.

How to Make the Most of These Insights

Focus on Usability: Gathering data isn’t enough; it’s essential to translate it into concrete actions that optimize the user experience.

Avoid Surface-Level Interpretations: Frequent clicks in an area don’t always indicate effectiveness—they could signal confusion or design issues.

Apply Data Strategically: Cross-referencing heatmaps with other metrics (like conversion rates and web analytics) enables informed decisions to improve the interface effectively.

The Impact on User Experience

When data is correctly analyzed and improvements are implemented based on it, the result is more intuitive, accessible, and effective experiences. This not only increases user satisfaction but also leads to higher conversions, better retention, and greater brand loyalty. In conclusion, heatmaps are a compass for digital optimization. Smart interpretation helps create more functional products aligned with real user needs.

Contact Us

More blog

About work, workshops, creative processes, new clients, old clients, daily life, and UX, epistemological thoughts, and critiques.

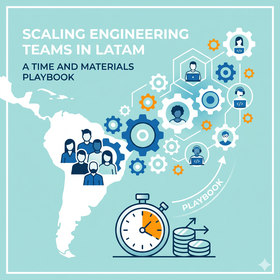
scaling-engineering-teams-in-latam-time-and-materials-playbook

Scaling Engineering Teams in LATAM: A Time and Materials Playbook for Agile Growth

Scaling engineering teams in LATAM has evolved from a simple cost-reduction tactic into a strategic necessity for product organizations facing severe domestic talent shortages. However, many technology leaders struggle with volatile product roadmaps, prolonged onboarding timelines, and rigid contract structures that stifle innovation. Failing to align team expansion with flexible procurement models directly degrades engineering velocity and inflates technical debt. This playbook delivers a operational framework using Time and Materials (T&M) structures to build highly adaptable, high-performing engineering hubs in Latin America that integrate seamlessly with your core product operations.

Read entry
managing-sprint-cycles-time-and-materials-engagement-agile-dashboard

Managing Sprint Cycles in a Time and Materials Engagement: Maximizing ROI in Agile Consulting

Organizations shifting to Agile product development often struggle to balance budget predictability with operational flexibility when working with external partners. Managing Sprint Cycles in a Time and Materials Engagement presents a unique challenge: the open-ended nature of the billing model can easily lead to unchecked scope creep and financial bleeding if the product backlog is poorly governed. Without a rigid framework that links engineering hours directly to measurable product increments, businesses face escalating burn rates without guaranteed delivery. This article outlines the precise governance, prioritization, and tracking mechanisms required to maintain fiscal discipline while leveraging the creative freedom of adaptive sprint cycles

Read entry
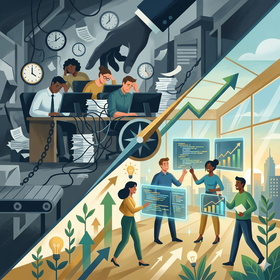
time-and-materials-vs-outsourcing-talent-retention-chart

Time and Materials vs. Outsourcing retention analysis for product engineering teams

Managing talent continuity in external engineering teams directly impacts product velocity, code quality, and time-to-market. When analyzing Time and Materials vs. Outsourcing retention, product and technology leaders frequently encounter high turnover rates that disrupt sprint cycles and dilute institutional knowledge. Traditional fixed-price outsourcing often incentivizes vendors to optimize for margin over talent satisfaction, resulting in rolling churn that stalls complex product development. Choosing the wrong engagement model creates hidden financial friction, as engineering onboarding cycles consume valuable senior leadership resources and delay core roadmap deliverables.

Read entry
pivoting product strategy in T&M contracts

The Flexibility Advantage: Pivoting Product Strategy in T&M Contracts

In the high-stakes world of digital product development, the only constant is change. Traditional fixed-scope contracts often act as a straightjacket, preventing teams from responding to market shifts or user feedback discovered during the build. This is where the strategic advantage of Time and Materials (T&M) models becomes apparent, offering the structural freedom necessary for high-growth companies.

Pivoting product strategy in T&M contracts is not merely about changing direction; it is about leveraging financial and operational flexibility to maximize business value. For product leaders, CX directors, and CTOs, understanding how to navigate these pivots is the difference between a failed launch and a market-leading innovation.

This article explores the mechanics of successful strategic shifts within T&M frameworks. We will analyze how to maintain budget discipline while embracing the "pivot," ensuring that every hour billed translates into a tangible step toward product-market fit.

Read entry
Strategic guide for scaling engineering teams in LATAM with time and materials model.

Scaling Engineering Teams in LATAM: A Time and Materials Playbook

For product and technology leaders in highly competitive markets, execution speed is the ultimate differentiator between staying relevant and becoming obsolete. However, local recruitment is often slow and prohibitively expensive, creating significant bottlenecks in the product roadmap. In this landscape, the scaling engineering teams in LATAM: a time and materials playbook emerges as the preferred solution for companies seeking high-quality talent, cultural affinity, and an efficient cost structure.

The Latin American region has evolved from being a "low-cost" option into a strategic hub for global innovation. The central question we address in this analysis is: how can companies implement a scaling engineering teams in LATAM: a time and materials playbook to optimize product delivery and cost efficiency? Understanding the mechanics of this model is vital for scaling without losing control over code quality or team cohesion.

Approaching scaling from a strategic perspective allows B2B, Fintech, and Insurtech organizations to adapt to unforeseen changes in demand without the rigidity of fixed-price contracts. Below, we break down the necessary tactics to ensure this transition becomes an operational and financial success.

Read entry
Senior development team collaborating on a high-scale digital product under a Time and Materials model.

Why the Best Developers Prefer Time and Materials over Fixed Price

In the world of high-stakes digital product development, the choice of engagement model is far more than a financial detail; it is a fundamental driver of project health and final output quality. For product leaders, CX directors, and CTOs, understanding why the best developers prefer Time and Materials over Fixed Price is essential for attracting and retaining the caliber of talent required to build resilient, market-leading solutions.

Fixed Price contracts often promise a sense of security through a locked-in budget and scope. However, for senior engineers and specialized agencies, this rigidity often creates a conflict of interest that pits profitability against technical excellence. In contrast, the Time and Materials (T&M) model fosters a culture of transparency and continuous improvement, allowing teams to focus on solving the right problems rather than just ticking off boxes in an outdated requirement document.

This article explores how the T&M model aligns the incentives of the business with those of the creators. We will examine the hidden costs of fixed scopes—such as technical debt and lack of innovation—and how a flexible approach allows organizations to leverage the full expertise of their partners to drive real business value in an ever-changing landscape.

Read entry
Strategic framework for overcoming cultural barriers in LATAM-US remote collaborations.

Overcoming Cultural Barriers in LATAM-US Remote Collaborations

The shift toward nearshoring has positioned Latin America as the premier partner for US-based technology and design firms. However, many organizations discover that proximity in time zones does not automatically translate to proximity in workplace culture. The friction often arises not from technical inability, but from unaddressed systemic differences in communication, hierarchy, and feedback loops.

For product leaders, CX directors, and CTOs, the challenge of overcoming cultural barriers in LATAM-US remote collaborations is the "last mile" of digital efficiency. Without a deliberate strategy to bridge these gaps, projects face delays, reduced morale, and a lack of authentic innovation. This article explores the deep-seated cultural dimensions that influence these partnerships and provides a roadmap for high-performing, cross-border integration.

Read entry
Remote stand-up management strategies in Time and Materials models for product leaders.

How to Manage Remote Stand-ups in Time and Materials Frameworks: Efficiency and Transparency

Effective remote stand-up management has become the operational nerve center for companies hiring technology and design services under the Time and Materials model. In an environment where every minute invested translates directly into an operating cost, the efficiency of these sessions is not just a matter of agility; it is a matter of financial health and mutual trust between client and provider.

The problem lies in the fact that, without a clear structure, daily meetings in distributed teams often degrade into micro-management sessions or endless status reports that dilute the value of the strategic profile. For product and technology leaders in sectors such as banking or insurance, understanding how to articulate these ceremonies is vital to ensuring that the flow of value does not stop due to communication friction.

How to optimize daily meetings in remote teams under a Time and Materials contract model to guarantee profitability and transparency? This post analyzes the tactics necessary to transform the daily session into an engine for visibility and cost control, ensuring that the investment in remote talent delivers measurable, high-quality results.

Read entry
Comparative chart of productivity and ROI across seniority levels in T&M projects.

The ROI of Senior LATAM Talent in Time and Materials Projects

The ROI of Senior LATAM talent is a critical factor in the management of technology projects and user experience design. Talent selection is often reduced to a simple comparison of hourly rates. Many organizations, pressured by quarterly budgets, opt for teams composed mostly of junior or mid-level profiles, assuming that lower operational costs automatically translate into savings. However, this vision ignores hidden frictions, reworks, and technical debt that emerge when execution lacks strategic depth.

The ROI of Senior LATAM talent is not measured solely by ticket delivery, but by the ability of these professionals to navigate ambiguity and optimize complex business processes. In regions like Latin America, the combination of cultural affinity, timezone overlap, and solid technical training creates a unique scenario for the Time and Materials (T&M) model, where senior efficiency becomes the primary driver of profitability.

Understanding the real question—What is the actual return on investment of hiring senior talent in Latin America under a Time and Materials model?—requires breaking down the impact of seniority on delivery speed, product quality, and risk reduction. In this article, we analyze why paying more per hour can, paradoxically, reduce the total cost of ownership of a digital product.

Read entry
Why 'Time and Materials' Supports Continuous Discovery in Agile

Why 'Time and Materials' Supports Continuous Discovery in Agile

In modern digital product development, uncertainty is not a bug in the system; it is an intrinsic feature of the market. Product and technology leaders often face the paradox of wanting innovative results while operating under rigid contractual structures. The "Fixed Price" model often promises budgetary security but frequently becomes a barrier to the adaptability and deep learning required by UX and true agility.

The success of a product does not depend on how faithfully a plan drawn up six months ago was followed, but on how quickly the team was able to pivot upon discovering that user needs had changed. This is where the relationship between the hiring model and the work methodology becomes critical. Continuous Discovery is not a phase, but a habit, and it requires an environment that does not punish change.

This article addresses the central question: Why is the Time and Materials (T&M) contract model the natural ally for implementing Continuous Discovery in Agile projects? We will explore how this financial structure allows organizations in banking, insurance, and fintech to transition from delivering features to delivering real value, minimizing waste and maximizing competitive relevance.

Read entry